
What does the bond investor do with rising interest rates? – Part 4 Currency management
(publication date: 10 May 2017, original published on 7 April 2017)
The Dutch text version of this article can be found on: https://www.iex.nl/Column/262952/Wat-te-doen-bij-stijgende-rente-IV.aspx
Introduction
In our search for an answer to the question in the title, we concluded in Part Three that the Carmignac Global Bond Fund showed a rising net asset value during the last few weeks even though interest rates were rising at the same time. The fund can short the bond market. However the fund’s average durationLooptijdmaatstaf voor obligaties/effecten waarbij rekening wordt gehouden met de toekomstige kasstromen. Het getal wordt vooral berekend om daarmede een modified duration van een obligatie te kunnen bepalen. Copyright Vladeracken was reduced to 0.12 years, which is a neutral position. So the recent positive returns could not have come from shorting the bond markets. This fund may also invest in other currencies and currently holds a strong position in other currencies. It is not just a bond fund, but a fund that can invest in interest-rate instruments in currencies other than just the €. And that brought us to the next chapter in our series: currency management.
Bonds denominated in other currencies than €
As an investor in the Netherlands, the purchase of bonds is naturally focused on bonds in €. You live and work in €, enjoy your retirement in €, your costs are in € and so you’re looking for income in €. But the interest you receive or pay differs for every currency unit. Even more, except for interest rates in Japan, interest rates in the € zone are lower than almost everywhere else in the world. And that is important because the value of currency units is strongly dependent on the so-called Carry tradeMen verkoopt een bepaalde valuta met lage rentetarieven en men investeert de opbrengst in valuta met duidelijk hogere rentetarieven. Een risicoDit wordt wel berekend als het product van de standaarddeviatie van de waardeontwikkeling van een portefeuille (aandeel) en de mutatiegraad op jaarbasis binnen deze portefeuille (van dit aandeel). Copyright Vladeracken ontstaat uit de verhouding tussen de valuta. Copyright Vladeracken possibilities.
Carry trade
Lets assume you borrow in the Netherlands € 10,000 for 10 years, and you buy $’s, which you then lend out interest-bearing for a period of ten years. Against your € 10,000 debt, you now hold a claim in $’s worth € 10,000. Net your possessions did not change because of thuis trade. This is called a Carry tradeMen verkoopt een bepaalde valuta met lage rentetarieven en men investeert de opbrengst in valuta met duidelijk hogere rentetarieven. Een risicoDit wordt wel berekend als het product van de standaarddeviatie van de waardeontwikkeling van een portefeuille (aandeel) en de mutatiegraad op jaarbasis binnen deze portefeuille (van dit aandeel). Copyright Vladeracken ontstaat uit de verhouding tussen de valuta. Copyright Vladeracken.
Interesting in this transaction is the fact that interest rates in the Netherlands are lower than interest rates in the United States. Suppose you could borrow the € 10 against the 10-year interest rate in the € zone and with the proceeds, you would buy US TreasuriesSchuldpapier van de Amerikaanse overheid uitgegeven door het Bureau of Public Debt. Men onderscheidt Treasury bills, Treasury notes, Treasury bonds en TIPS. Copyright Vladeracken with a term of 10 years. Then you pay (aside from costs and margins for risk and trade) 0.50% and you receive 2.35%, each year again. This gives you a gross return of 1.85% per annum without having to spend money (apart from any margin requirements). This transaction is difficult to enact for individuals. Costs and risk conditions make this a virtually impossible story. But for professionals who have access to institutional markets for currencies, derivatives and interest rates, the costs are significantly lower. To them this is a very possible trade.
Currency risk
In theory, the parties will buy the currency unit where the interest rate is higher and sell the currency unit where the interest rate is lower. For some time this has been the main reason behind the strength of the $ against the €. But only the sun rises at no cost. The downside is that exchange rates sometimes also move the other way. For in the end, a currency unit is also a product, that becomes more expensive when it gets scarce and vice versa. If a national bank or government prints too much of its own currency, then the value of that coin corrects and eventually it may even become worthless. This is the situation of (hyper) inflation. The paradox is that interest rates increase in times of hyperinflation, but never high enough to counteract the depreciating effect on the value of your coin due to that inflation.
Carry trades can therefore only be interesting when inflation in the two currency zones between which one speculates, develops more or less the same. And for this reason, a Carry tradeMen verkoopt een bepaalde valuta met lage rentetarieven en men investeert de opbrengst in valuta met duidelijk hogere rentetarieven. Een risicoDit wordt wel berekend als het product van de standaarddeviatie van de waardeontwikkeling van een portefeuille (aandeel) en de mutatiegraad op jaarbasis binnen deze portefeuille (van dit aandeel). Copyright Vladeracken ontstaat uit de verhouding tussen de valuta. Copyright Vladeracken between the $ and the € makes sense while a Carry tradeMen verkoopt een bepaalde valuta met lage rentetarieven en men investeert de opbrengst in valuta met duidelijk hogere rentetarieven. Een risicoDit wordt wel berekend als het product van de standaarddeviatie van de waardeontwikkeling van een portefeuille (aandeel) en de mutatiegraad op jaarbasis binnen deze portefeuille (van dit aandeel). Copyright Vladeracken ontstaat uit de verhouding tussen de valuta. Copyright Vladeracken between the € and the Venezuelan Bolivar is completely nonsensical, even though the interest rate in Venezuela is significantly higher than in the € zone.
There are many examples of people who bought a home in their own country (Poland, Hungary) and financed the purchase with a mortgage loan in another currency (for example, the Swiss Franc) because the interest rate in that currency at the time was so much lower than the interest rate in their own country and their own currency. All these people got into trouble when their own currency then devalued significantly against the Swiss Franc. The level of their debt (in Swiss Francs) remained the same, whereas the value of the collateral (their own house and their income) decreased significantly. In many cases the mortgage debt doubled in the local currency.
Interest differential between $’s and €
In graph 7 we have included a graph showing the difference between the 10-year yield in the € zone and 10-year yield in $’s (US TreasuriesSchuldpapier van de Amerikaanse overheid uitgegeven door het Bureau of Public Debt. Men onderscheidt Treasury bills, Treasury notes, Treasury bonds en TIPS.
Copyright Vladeracken).
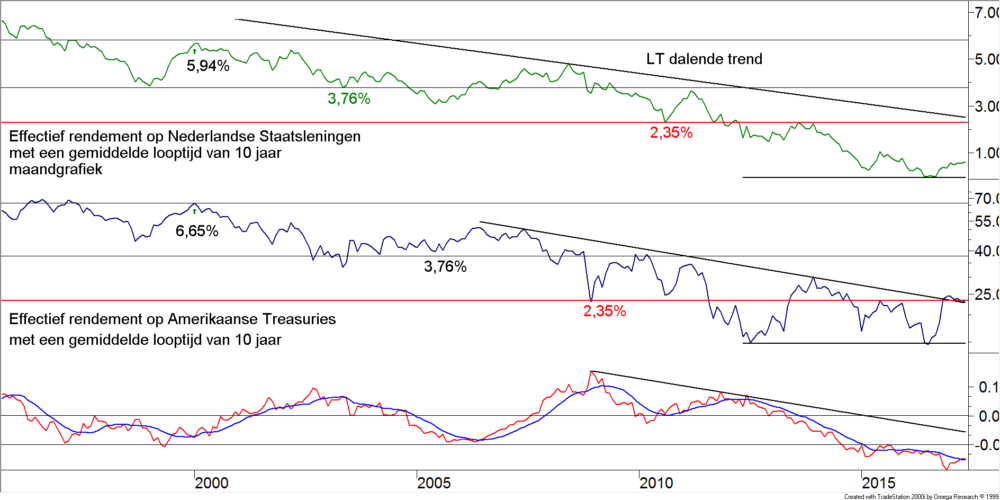
Graph 7.
Those who read our articles more often know this chart. It is one of the basic graphs in our analysis we use when looking at the currency risks in our clients’ portfolios. The top green curve shows the monthly development of 10-year interest rates in the € zone since 1995. The blue curve in the middle is the development of 10-year interest on US TreasuriesSchuldpapier van de Amerikaanse overheid uitgegeven door het Bureau of Public Debt. Men onderscheidt Treasury bills, Treasury notes, Treasury bonds en TIPS. Copyright Vladeracken ($’s) and the bottom line shows difference between these two. The red line is the monthly difference and the blue curve passing through it is an average of the red line. The difference has, in the past 25 years shown, never been as big as it currently is (in favor of the $). That the $ has been stronger over the past few years compared to the € should not be surprising. And the answer to whether this difference will increase further depends, of course, primarily on the policies implemented by the Central Banks in the US and in Europe and by what the respective governments will do in the coming years.
Government policy and QE-programs
The US FED several weeks ago for the first time discussed reducing its own balance sheet. Since 2008, the FED has conducted several QE programs buying a huge amount of US government bonds. For a while now, no new bonds have been purchased, but the bonds being redeemed are still being replaced by new bonds. As such, the FED does not add any new money to the market, but the previously created amount of money has not yet been withdrawn from the market. But in the first week of April, the FED announced that, at the end of this year, it would possibly stop replacing bonds in its own portfolio that are being redeemed by the US government. This is the final step (along with the already rising short term interest rates) in the US normalization process. In Europe, one has not yet gotten as that far into the process. Here still new bonds are purchased by the ECB every month. But the ECB has already indicated, that the purchase of new bonds will come to an end late this year or early next year. This means that the ECB is running behind about one year in its policy compared to the FED. So here too the end of the easy money era is nearing.
On balance, this phase difference argues for a constant or even increasing difference between the US interest rates and interest rates in Europe. This is also the reason why most analysts still expect parity between $ and € to be reached during the course of this year. The $ would, in this scenario, appreciate another 9 cents to the €.
Monetary financing of government deficits
But there is another source of new money in each country and that is the government itself. In the United States, since the independence in 1776, the dominant (Pavlov) reaction to any problem in the US economy has been to print $ ‘s. This has been a constant whenever the US government deficit grew significantly every time the economy got into trouble. Deficits of 8% or more per annum are no exception. In Europe, on the other hand, it is a legal requirement for governments to keep their deficit structurally below 3% per annum. If this deficit reaches 3% or more, national governments have to cut their budget. Now you will rightly say that several countries, like France for example, have never met this requirement. But these agreements in fact do create the situation that in France the deficits do not rise unreasonably high. All European governments (as far as they have the € as a their local currency) carry a statutory restrictive fiscal policy. This leads to a structurally lower inflation rate in Europe, and thus a structurally lower interest rate, and at the same time a structurally stronger currency compared to the $.
In this picture, the $ may be stronger than the € from time to time, mainly due to the fact that the interest rate differentials will increase, but in the long run the € will become stronger and stronger. Even if parity will be reached, that will only hold for a relatively short period. One should rather expect the € to reach $ 2 for each € in the long run.
Currency of safety
But of course there is another third, not unimportant problem for the € and that is the problem of trust. Whoever spoke to American analysts this year will have heard without exception that in the U.S. the question is not asked whether the € will survive, but only when the € breaks apart. Every time a crisis occurs in the world, the $ is always a point of refuge. The $ is therefore the most important reserve currency in the world, which generates strength. If the discussion about the survival of the € zone is not stopped then that will keep the € under pressure. In this sense, the elections in France, Germany and Italy are extremely important this year, and the discussion about Greece, which recently reemerged, is also important.
Carry trades and currency risks
All these considerations are essential when investors decide to expose themselves to the risks in other currencies through Carry trades. And then we have not talked about the British Pound, the Japanese Yen, Mexican Pesos, the Brazilian Real and so on. It is a completely different game than investing in equities or bonds. But if you wish to invest in bonds that are out of the € zone, you should not underestimate currency risk. We therefore encourage you to hand over active currency management, in case you invest in bonds, to a professional party (a wealth manager or investment fund) such as the Carmignac Global Bond Fund that we discussed in our previous article in this series.
Bonds denominated in other non-€ and non-$ currencies
But there is yet another possibility. Consider (by way of an example, there are many more such funds) the db x-trackers II Emerging Markets Liquid Eurobond UCITS ETF. This is an Exchange Traded Fund (ETF), a trackerExchange Traded Funds. Via de beurs verhandelbare, passief beheerde beleggingsfondsen, die de performance van een index volgen. Er zijn ETF’S op markt- en sectorindexen. Men maakt onderscheid tussen ETF’s op Cash-Basis en ETF’s op Swap-Basis. Zie ook ETF op Cash-Basis en ETF op Swap-Basis.
Copyright Vladeracken, which invests in a portfolio of bonds from countries within the Emerging Markets category. The fund is an index fund, which means that there is no active investment policy, but a predefined index is followed. In this case, the “Deutsche Bank Emerging Markets Liquid Eurobond Index” is followed. The index includes government bonds and government-guaranteed bonds denominated in €, US $, Japanese Yen, or British Pounds, with the fund hedging the $, Yen, and Pound risks. As a result, you have a portfolio without currency risk of bonds guaranteed by Emerging Markets Guarantors. The most recent overview, which we have taken directly from the fund’s factsheet dated 28 February 2017, is shown in Figure 8. Half of the fund is invested in government bonds or government-guaranteed institutions from Mexico, Poland, Turkey, Indonesia and Brazil.
![]()
Graph 8.
db x-trackers II Emerging Markets Liquid Eurobond UCITS ETF
The fund’s ISIN code is LU0321462953. The fund does not pay-out any dividends, so any interest income generated remains within the fund. Each year, a percentage of 0.55% of the fund will be charged as costs and you will incur transaction costs when purchasing or selling the fund. The bonds held have a rating of B3 up to A2, all investment grade thus, with the bulk (89%) Ba2 or better. The average coupon is 4.68% (this varies in time of course) and the durationLooptijdmaatstaf voor obligaties/effecten waarbij rekening wordt gehouden met de toekomstige kasstromen. Het getal wordt vooral berekend om daarmede een modified duration van een obligatie te kunnen bepalen. Copyright Vladeracken is 6.6 years. The fund invests by default in bonds with maturities of 5 to 30 years and strives for an average repayment period of 9 years. This is the first hitch as even though the average maturity is relatively low at the moment, it is still high if a worldwide increase in interest rates is expected.
Synthetic tracker
A second issue is the fact that this is a synthetic trackerExchange Traded Funds. Via de beurs verhandelbare, passief beheerde beleggingsfondsen, die de performance van een index volgen. Er zijn ETF’S op markt- en sectorindexen. Men maakt onderscheid tussen ETF’s op Cash-Basis en ETF’s op Swap-Basis. Zie ook ETF op Cash-Basis en ETF op Swap-Basis. Copyright Vladeracken. The index is imitated using derivatives. The fund itself does not buy the relevant bonds. Instead, the fund buys the investment grade bonds and holds deposits in the money market, and then hedges this portfolio using derivatives purchased from Deutsche Bank, the parent of the issuer (Deutsche Bank Asset Management AG) in order to generate the index-related risk it propagates. The basis of the portfolio is therefore relatively safe, but you do have the counterparty risk of Deutsche Bank.
Regular review of the underlying index
A third potential problem is the fact that the underlying index is determined by Deutsche Bank itself and that this index is revised at least once a year. DB may even revise the index every month and it is not easy to find out what exactly the rules are for this review. DB writes itself: “The Index follows a rule-based strategy that cannot be adjusted to take into account changing market conditions. It is therefore possible that you do not benefit from such a change or that you are exposed to risks that could have been avoided by an active investment manager.” But what exactly these rules are, is not included.
Actual performance – price chart
The fund was founded in 2008 and has a listing on the Xetra, Swiss SIX and Italian stock exchange. It is also available in the Netherlands, but not every bank gives its investors access to trackers on the Xetra, so whether you can buy them at your own bank is uncertain. At Binck Bank, the trackerExchange Traded Funds. Via de beurs verhandelbare, passief beheerde beleggingsfondsen, die de performance van een index volgen. Er zijn ETF’S op markt- en sectorindexen. Men maakt onderscheid tussen ETF’s op Cash-Basis en ETF’s op Swap-Basis. Zie ook ETF op Cash-Basis en ETF op Swap-Basis.
Copyright Vladeracken can be bought.
![]()
Graph 9.
Graph 9 shows the price development of this fund. We have drawn a rising trendDe richting van de markt. Een opwaartse trend wordt gekarakteriseerd door een opeenvolging van hogere bodems en hogere toppen. Een neerwaartse trend wordt gekarakteriseerd door een opeenvolging van lagere bodems en lagere toppen. Copyright Vladeracken line that reflects an average historical return of 5.2% per annum. This includes all fund costs, but transaction costs are not taken into account. We measured the return during the period from 1 August 2008 to 31 March 2017, 8.67 years. But investing in Emerging Markets, even when it comes to bonds, is never without risks. Look at the losses that occurred in 2008 (a decrease of 33.5%) and in 2013 (a decrease of 19.5%). In balance, little has happened because the prices of these types of bonds recovered fairly quickly. But if the price drops, then it’s fast! At the far right of the chart one can also see a smaller decrease. This drop is due to the rhetoric of President Trump against Mexico, which led to a sharp fall in the value of the Mexican Peso and a simultaneous rise in interest rates in Mexico, and since this index is invested in Mexican bonds for more than 10% and also has a relatively long average maturity, this event had a significant impact on the net asset value of this fund. The figure shows that there are long periods during which no returns are generated, for example, the fund did not yield any returns between 2014 and the beginning of 2016. Meanwhile, interest rates came in (which thus led to price losses) and also costs kept being charged by the fund manager. And who bought the fund at the end of 2012 had gained nothing after 4 years, late 2016, due to President Trump’s election.
Other trackers in this area
Of course this is not the only trackerExchange Traded Funds. Via de beurs verhandelbare, passief beheerde beleggingsfondsen, die de performance van een index volgen. Er zijn ETF’S op markt- en sectorindexen. Men maakt onderscheid tussen ETF’s op Cash-Basis en ETF’s op Swap-Basis. Zie ook ETF op Cash-Basis en ETF op Swap-Basis. Copyright Vladeracken of its kind. In Figure 10 we give you another example. It isn’t completely comparable, which shows another problem to these types of funds: you need to do your homework first to find out what exactly you are buying. Now we show you the price development of the iShares JP Morgan US $ Emerging Markets Bond ETF. The ISIN code of this fund is US4642882819. The fund is listed in US $, a physical trackerExchange Traded Funds. Via de beurs verhandelbare, passief beheerde beleggingsfondsen, die de performance van een index volgen. Er zijn ETF’S op markt- en sectorindexen. Men maakt onderscheid tussen ETF’s op Cash-Basis en ETF’s op Swap-Basis. Zie ook ETF op Cash-Basis en ETF op Swap-Basis. Copyright Vladeracken (actually buys the bonds in the index) returns dividend (currently about 5.1% per annum) but has a completely different composition than the db x trackerExchange Traded Funds. Via de beurs verhandelbare, passief beheerde beleggingsfondsen, die de performance van een index volgen. Er zijn ETF’S op markt- en sectorindexen. Men maakt onderscheid tussen ETF’s op Cash-Basis en ETF’s op Swap-Basis. Zie ook ETF op Cash-Basis en ETF op Swap-Basis. Copyright Vladeracken which we discussed above. For example, the biggest country position is Mexico, but by only 6.3% (April 6th) it’s still significantly less than the db x trackerExchange Traded Funds. Via de beurs verhandelbare, passief beheerde beleggingsfondsen, die de performance van een index volgen. Er zijn ETF’S op markt- en sectorindexen. Men maakt onderscheid tussen ETF’s op Cash-Basis en ETF’s op Swap-Basis. Zie ook ETF op Cash-Basis en ETF op Swap-Basis. Copyright Vladeracken holds. Poland, Turkey, Indonesia and Russia, the JP Morgan trackers has an exposure to each of these countries of between 3.9% and 5.1%. The diversification of country and currency risk is therefore much better, but the average risk is still higher in terms of rating than with the db x trackerExchange Traded Funds. Via de beurs verhandelbare, passief beheerde beleggingsfondsen, die de performance van een index volgen. Er zijn ETF’S op markt- en sectorindexen. Men maakt onderscheid tussen ETF’s op Cash-Basis en ETF’s op Swap-Basis. Zie ook ETF op Cash-Basis en ETF op Swap-Basis. Copyright Vladeracken. This is because there are also countries in this fund, the risk of which is CC to BB. As such 2.2% of the fund is invested in Venezuelan bonds, something that does not happen at Deutsche Bank’s fund.
In addition, the durationLooptijdmaatstaf voor obligaties/effecten waarbij rekening wordt gehouden met de toekomstige kasstromen. Het getal wordt vooral berekend om daarmede een modified duration van een obligatie te kunnen bepalen.
Copyright Vladeracken is 6.94 years, the average durationLooptijdmaatstaf voor obligaties/effecten waarbij rekening wordt gehouden met de toekomstige kasstromen. Het getal wordt vooral berekend om daarmede een modified duration van een obligatie te kunnen bepalen.
Copyright Vladeracken is more than 10 years and the costs within the fund (the Expense Ratio) is 0.59%, with the Fund on its website indicating a discount of 0.19%. So the actual costs would be 0.4% per annum.
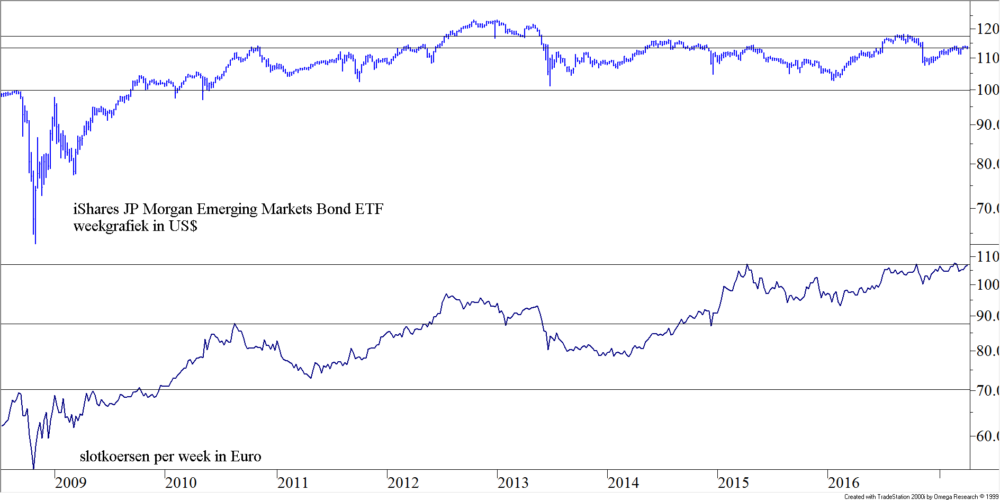
Graph 10.
In the top half of the graph, you’ll see the fund’s development in US $. The fund returns dividend each year, which distorts the picture compared with Figure 9. The price is now moving fairly sideways, but with a dividend yield of approximately 5.1%, this does not differ significantly from Deutsche Bank’s trackerExchange Traded Funds. Via de beurs verhandelbare, passief beheerde beleggingsfondsen, die de performance van een index volgen. Er zijn ETF’S op markt- en sectorindexen. Men maakt onderscheid tussen ETF’s op Cash-Basis en ETF’s op Swap-Basis. Zie ook ETF op Cash-Basis en ETF op Swap-Basis. Copyright Vladeracken performance. But in the lower half of the chart we converted the rate into Euro. And now it makes a difference, because in this period the € has fallen on average, so you also benefit from the $ increase in the price. That adds a lot to the return, but the comparison is no longer fair. Because in fact you now have a $ investment. If the $ risk is to be hedged, then the interest rate differential per annum (figure 7) now costs about 1.85%. And then you do not have a better investment here, because that 1.85% must be deducted from the dividend yield of 5.1%!
Conclusion
Due to the relatively high interest rate, investment in government bonds of other countries without currency risk is a good alternative to investments in larger-country bonds in the € zone. But do not do it yourself and do not do that for the complete portfolio. Because you have a relatively large maturity risk and Emerging Markets are much more vulnerable to political and other uncertainties than others such as Germany, the US or other major economic powers. So use a trackerExchange Traded Funds. Via de beurs verhandelbare, passief beheerde beleggingsfondsen, die de performance van een index volgen. Er zijn ETF’S op markt- en sectorindexen. Men maakt onderscheid tussen ETF’s op Cash-Basis en ETF’s op Swap-Basis. Zie ook ETF op Cash-Basis en ETF op Swap-Basis. Copyright Vladeracken, knowing the funds listed here are just examples. As to our preference, we prefer the Deutsche Bank trackerExchange Traded Funds. Via de beurs verhandelbare, passief beheerde beleggingsfondsen, die de performance van een index volgen. Er zijn ETF’S op markt- en sectorindexen. Men maakt onderscheid tussen ETF’s op Cash-Basis en ETF’s op Swap-Basis. Zie ook ETF op Cash-Basis en ETF op Swap-Basis. Copyright Vladeracken. The fund is listed in €, the maturity appears to be somewhat shorter and the composition of the portfolio is better in terms of credit risk.
Next subject
And that takes us to the next subject in this series. Instead of going for maturity risk, one could also look for credit risks. In a next article we will discuss how some fund managers use active or passive management of credit risks to generate consistent returns.
The Hague, 10 May 2017
Gijsbrecht K. van Dommelen
Vladeracken Vermogensbeheer
Disclaimer
The author is responsible for the investment policy at Vladeracken BV, an asset management company licensed by the AFM. Vladeracken invests and / or has invested in the securities discussed herein on behalf of its clients. This piece is not an investment advice. Whoever invests in the securities discussed herein and in accordance with the methodology and arguments discussed, or wants to invest accordingly does for his or her own accountability and risk. In this context, the author and Vladeracken BV disclaim all responsibility for the contents of this article. The securities and methods discussed represent a high risk.


Plaats een Reactie
Meepraten?Draag gerust bij!